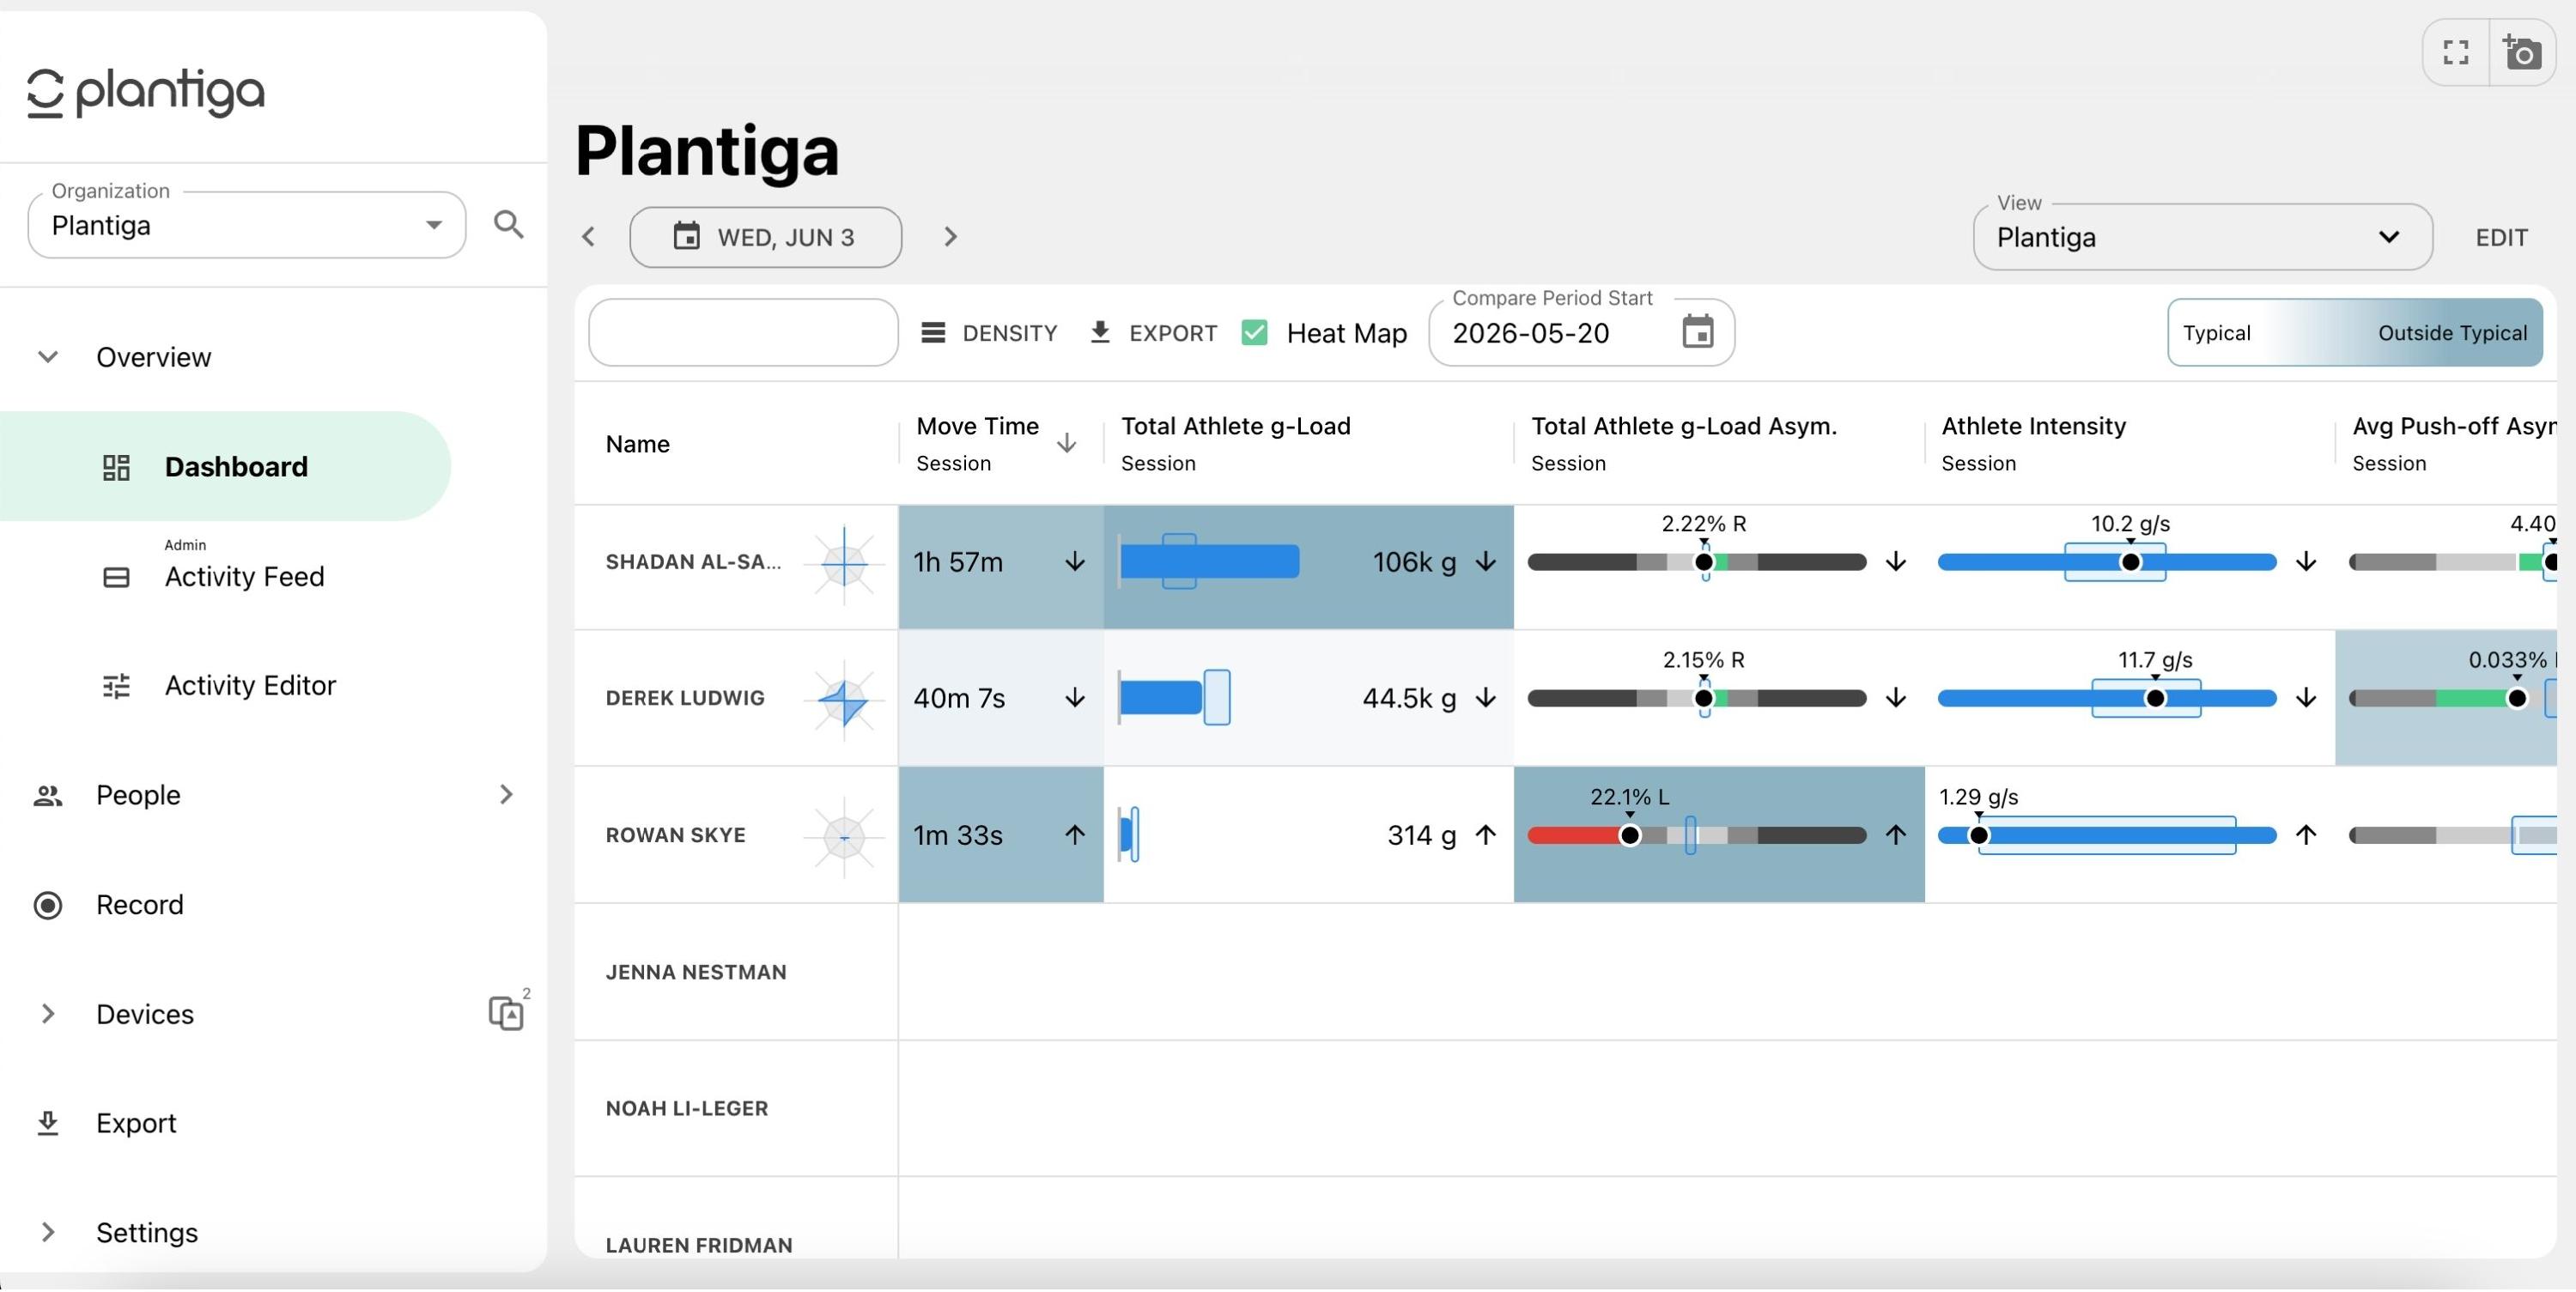
Overview Dashboard
Get a quick snapshot of the activities collected by all the people in your organization.
Getting there
Get to the Overview by clicking the drop-down arrow beside "Overview" in the left navigation bar, then clicking "Dashboard".
You'll see a list of people in your organization and a horizontal scroll summarizing that day's data.
Navigating the Overview
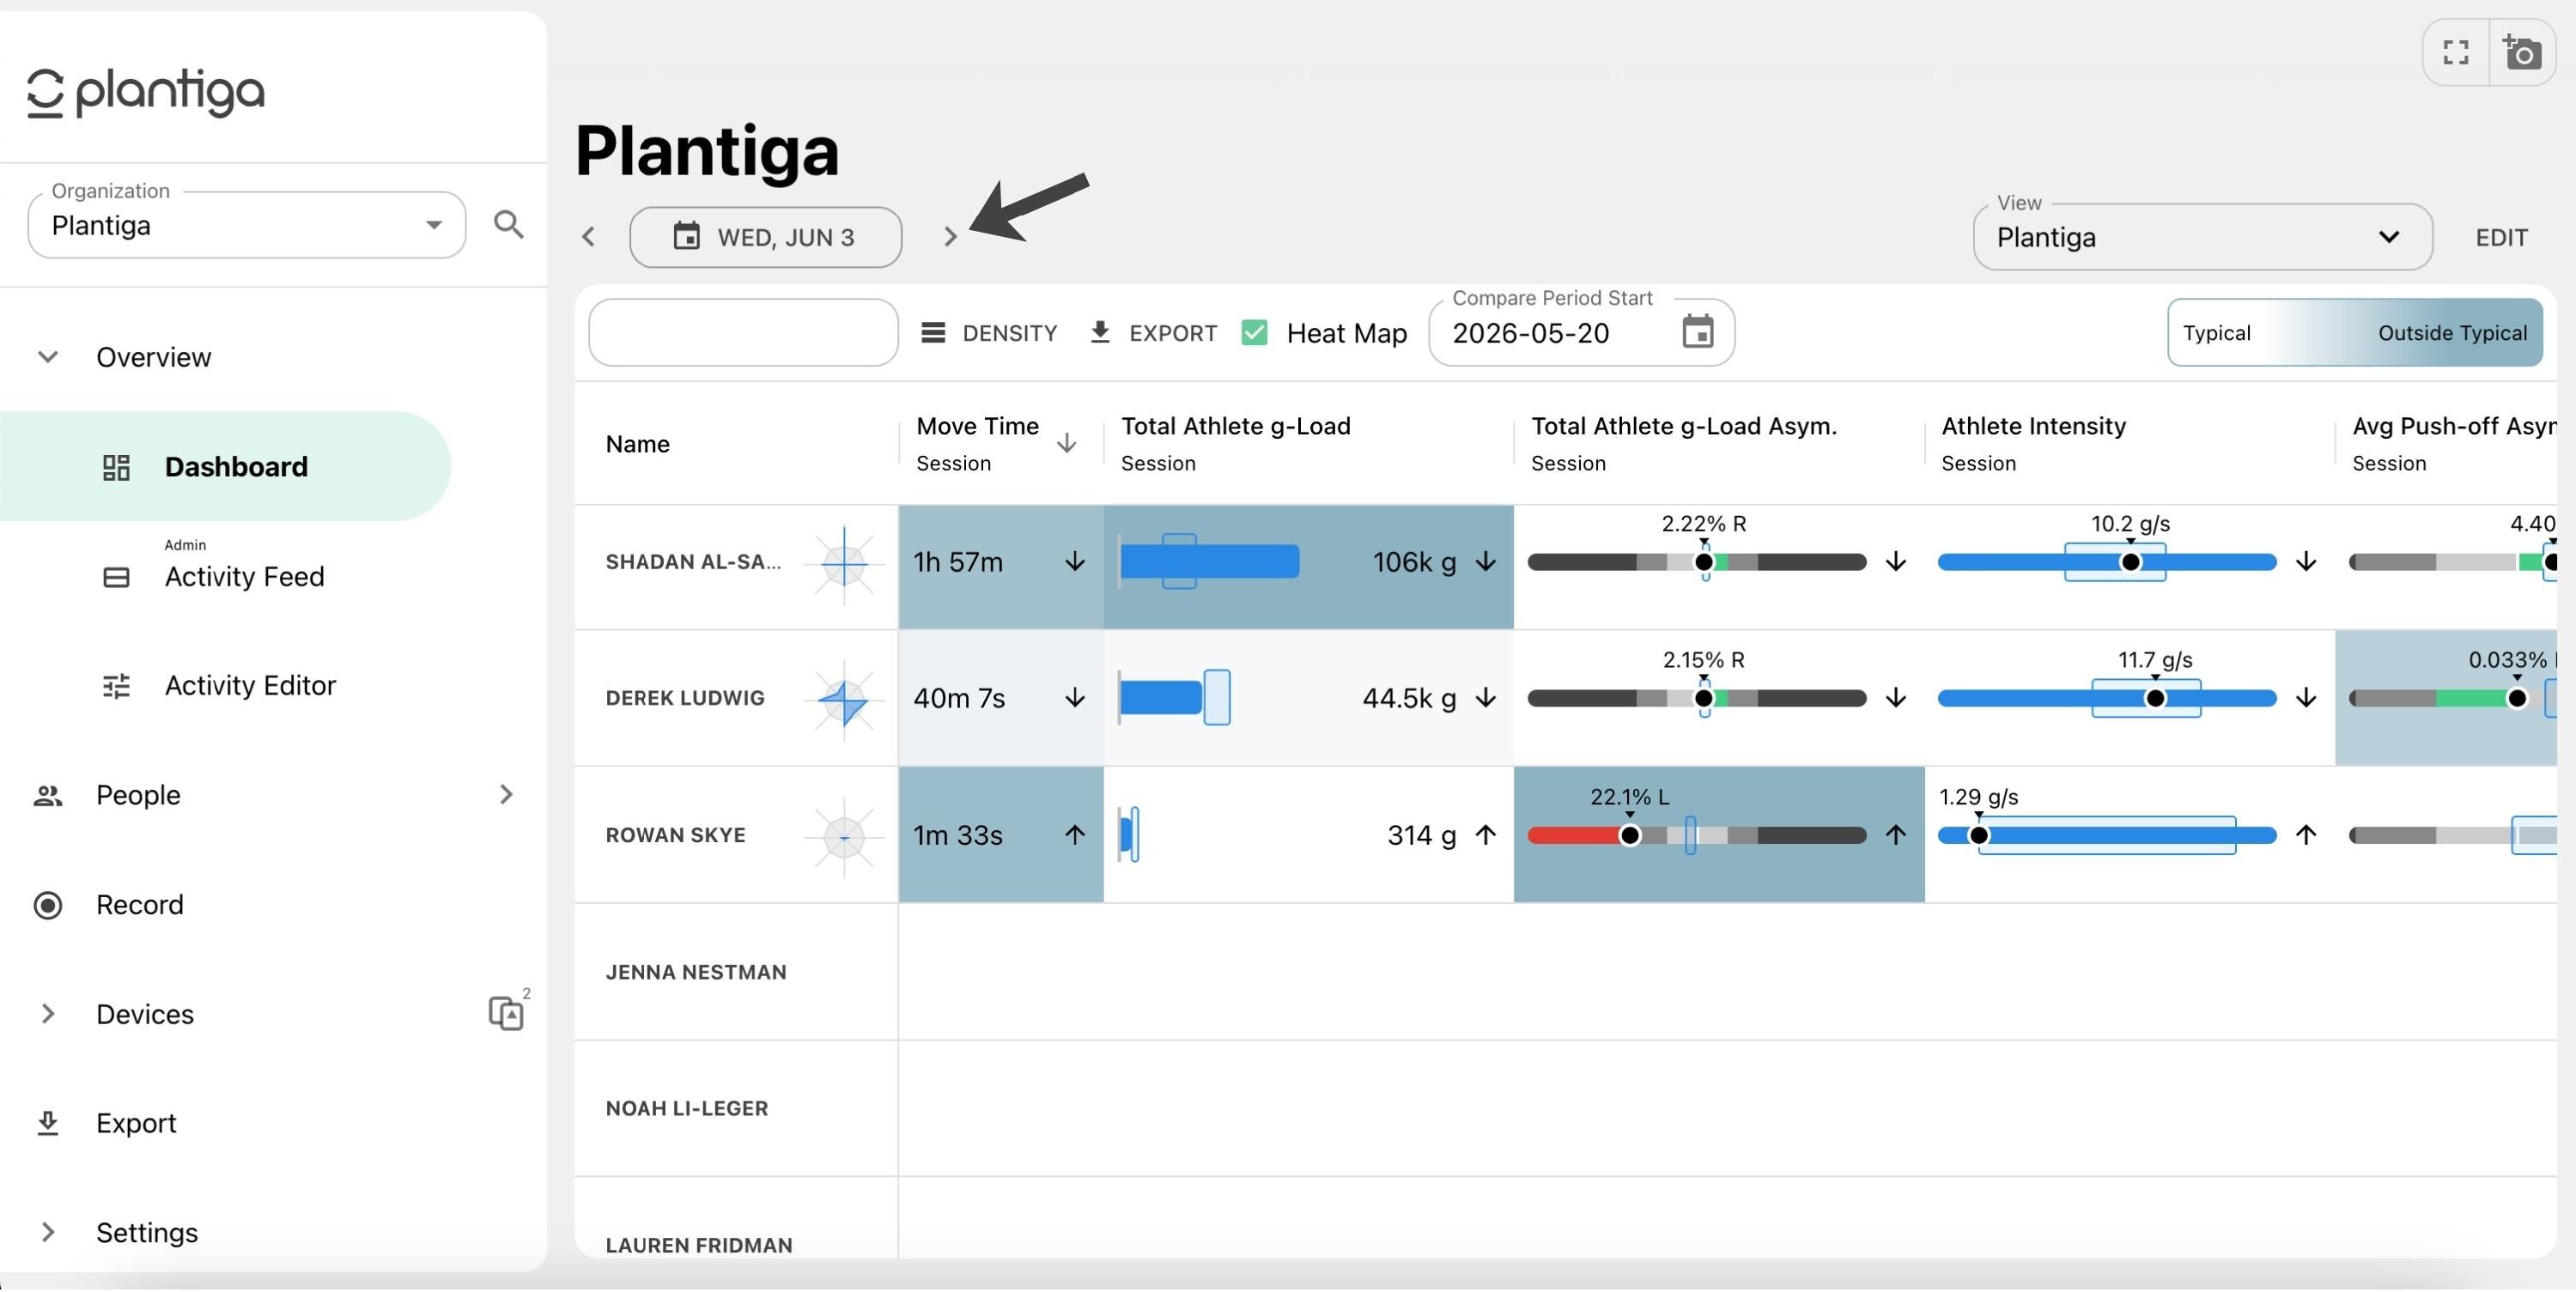
You can scroll to previous days using the arrow keys below the organization title.
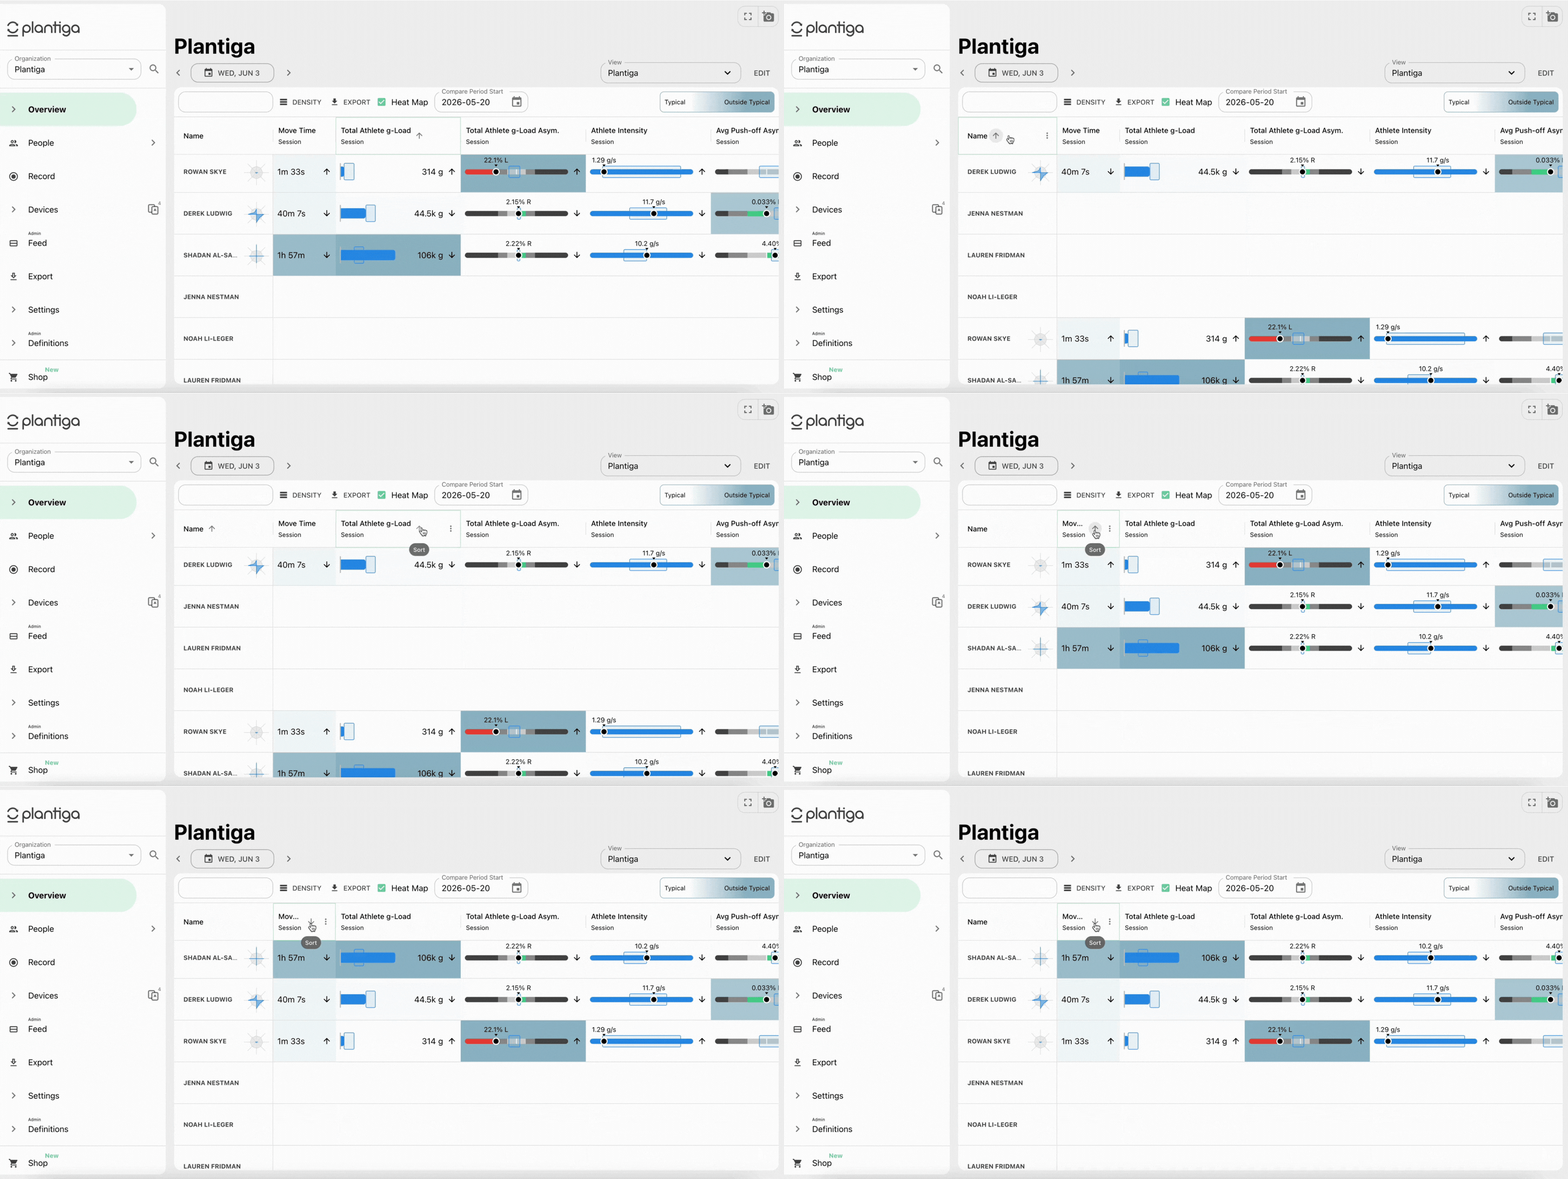
You can sort the data from top to bottom by clicking on each of the column headers in the top row.
Radar charts
You can navigate to a radar chart by clicking on the widget beside an athlete's name.
The radar chart allows you to compare data collected on the selected day to the average of all data collected over the Compare Period Start date.
Radar Charts can be set to compare the athlete to themselves or the team using the toggle switch.
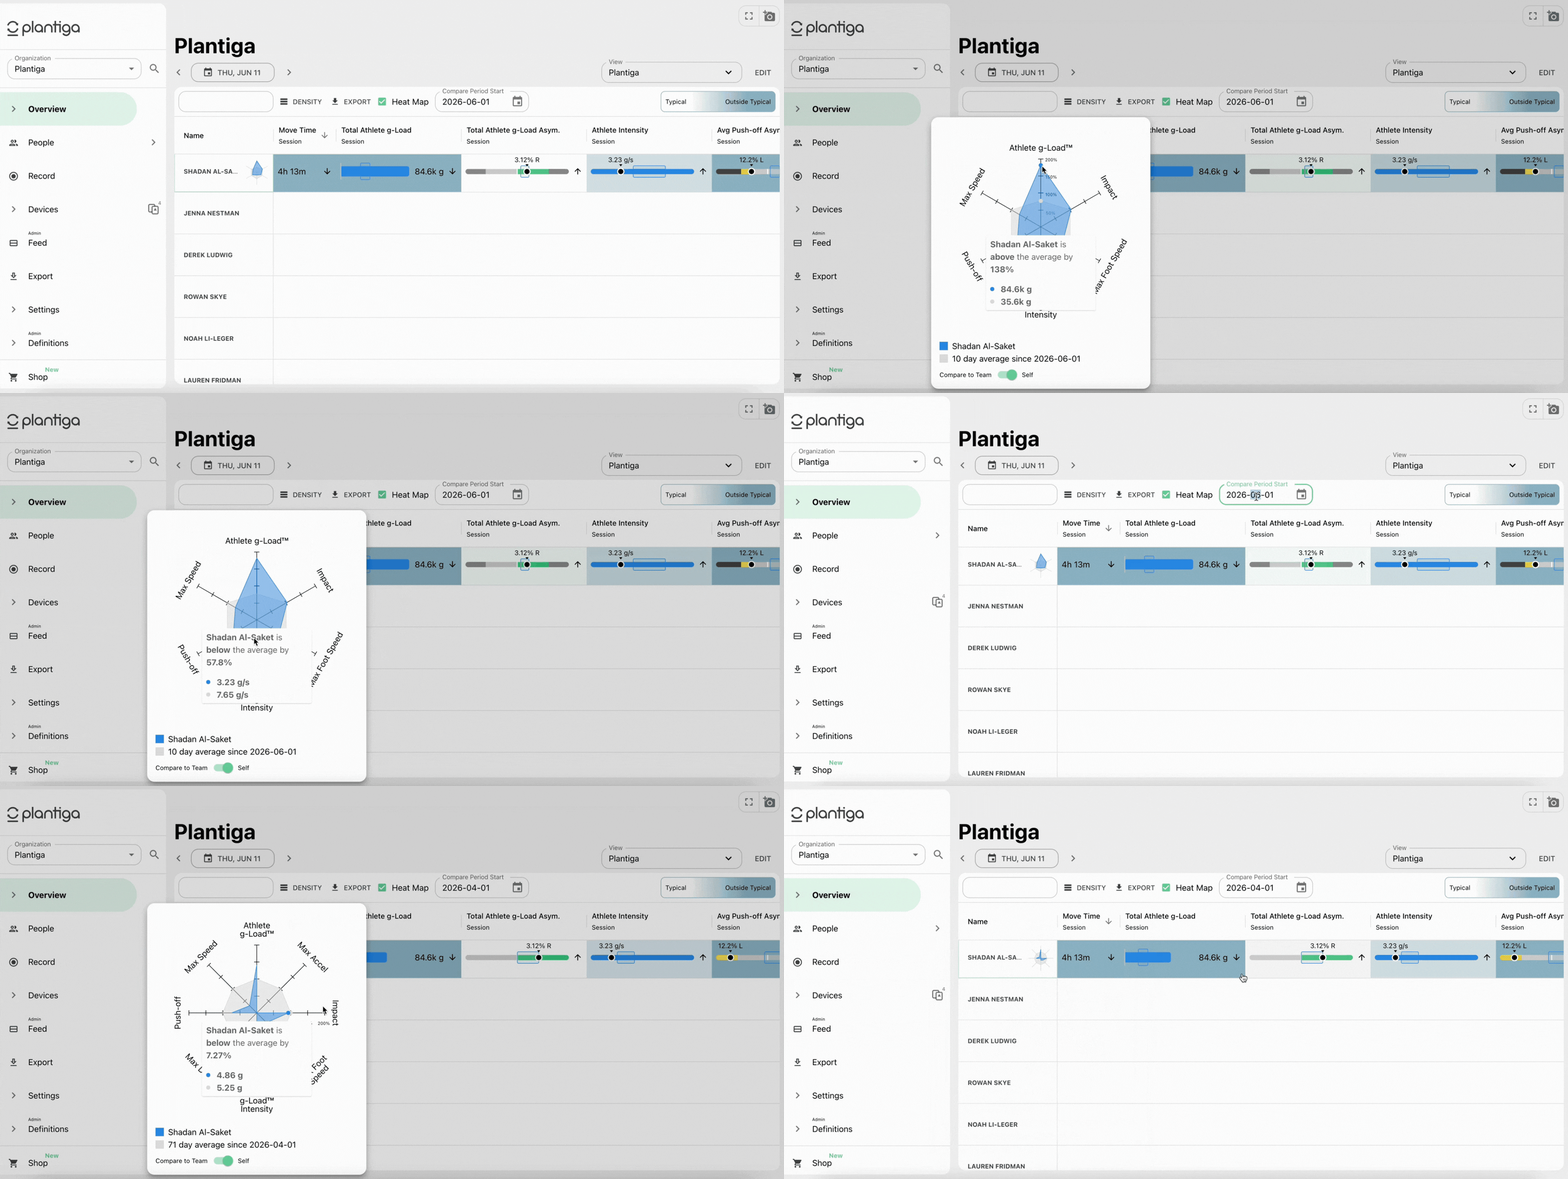
Customizing your Overview
The Overview can be customized across an organization, for the specific metrics that matter to you.
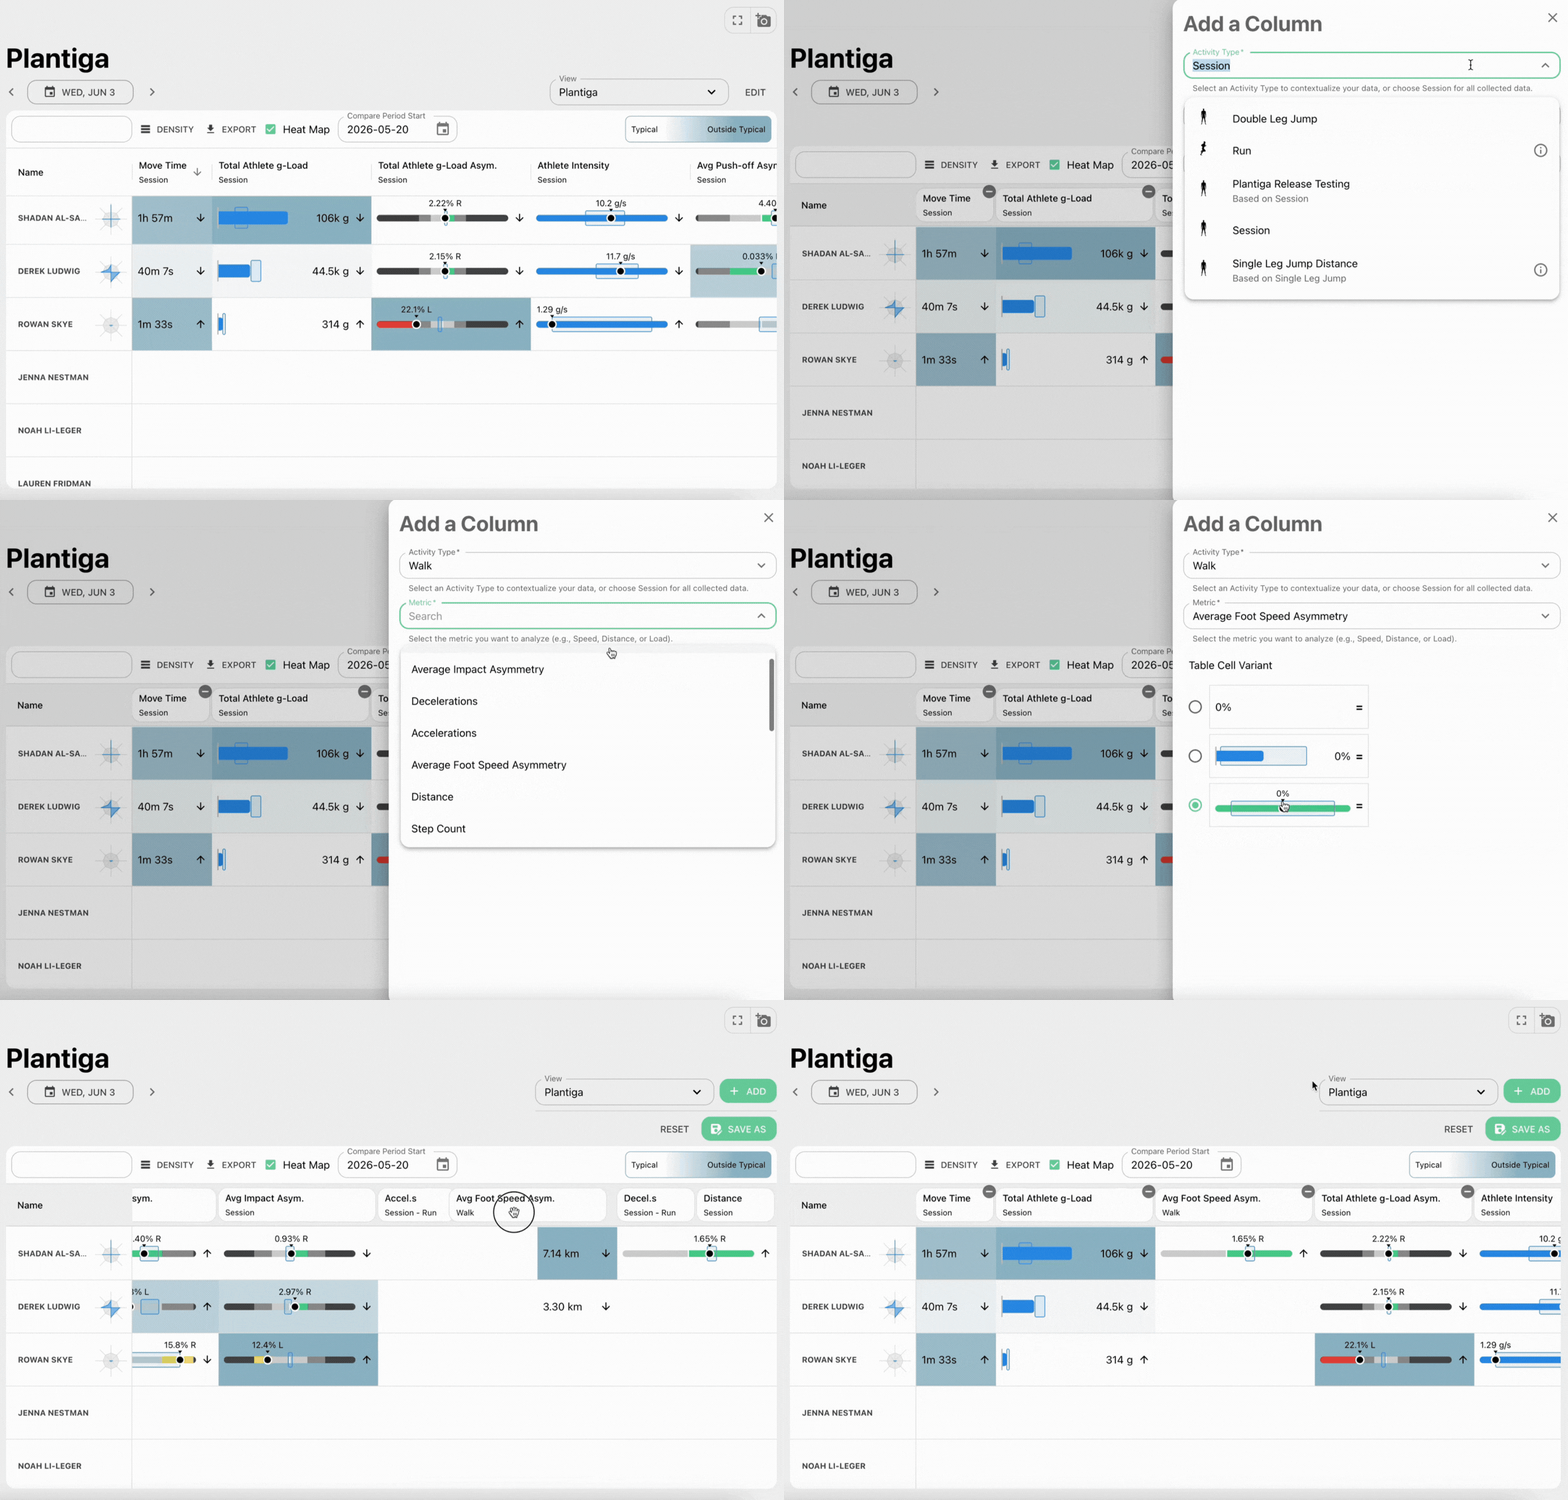
Click EDIT on the top right to rearrange, add, and remove metrics.
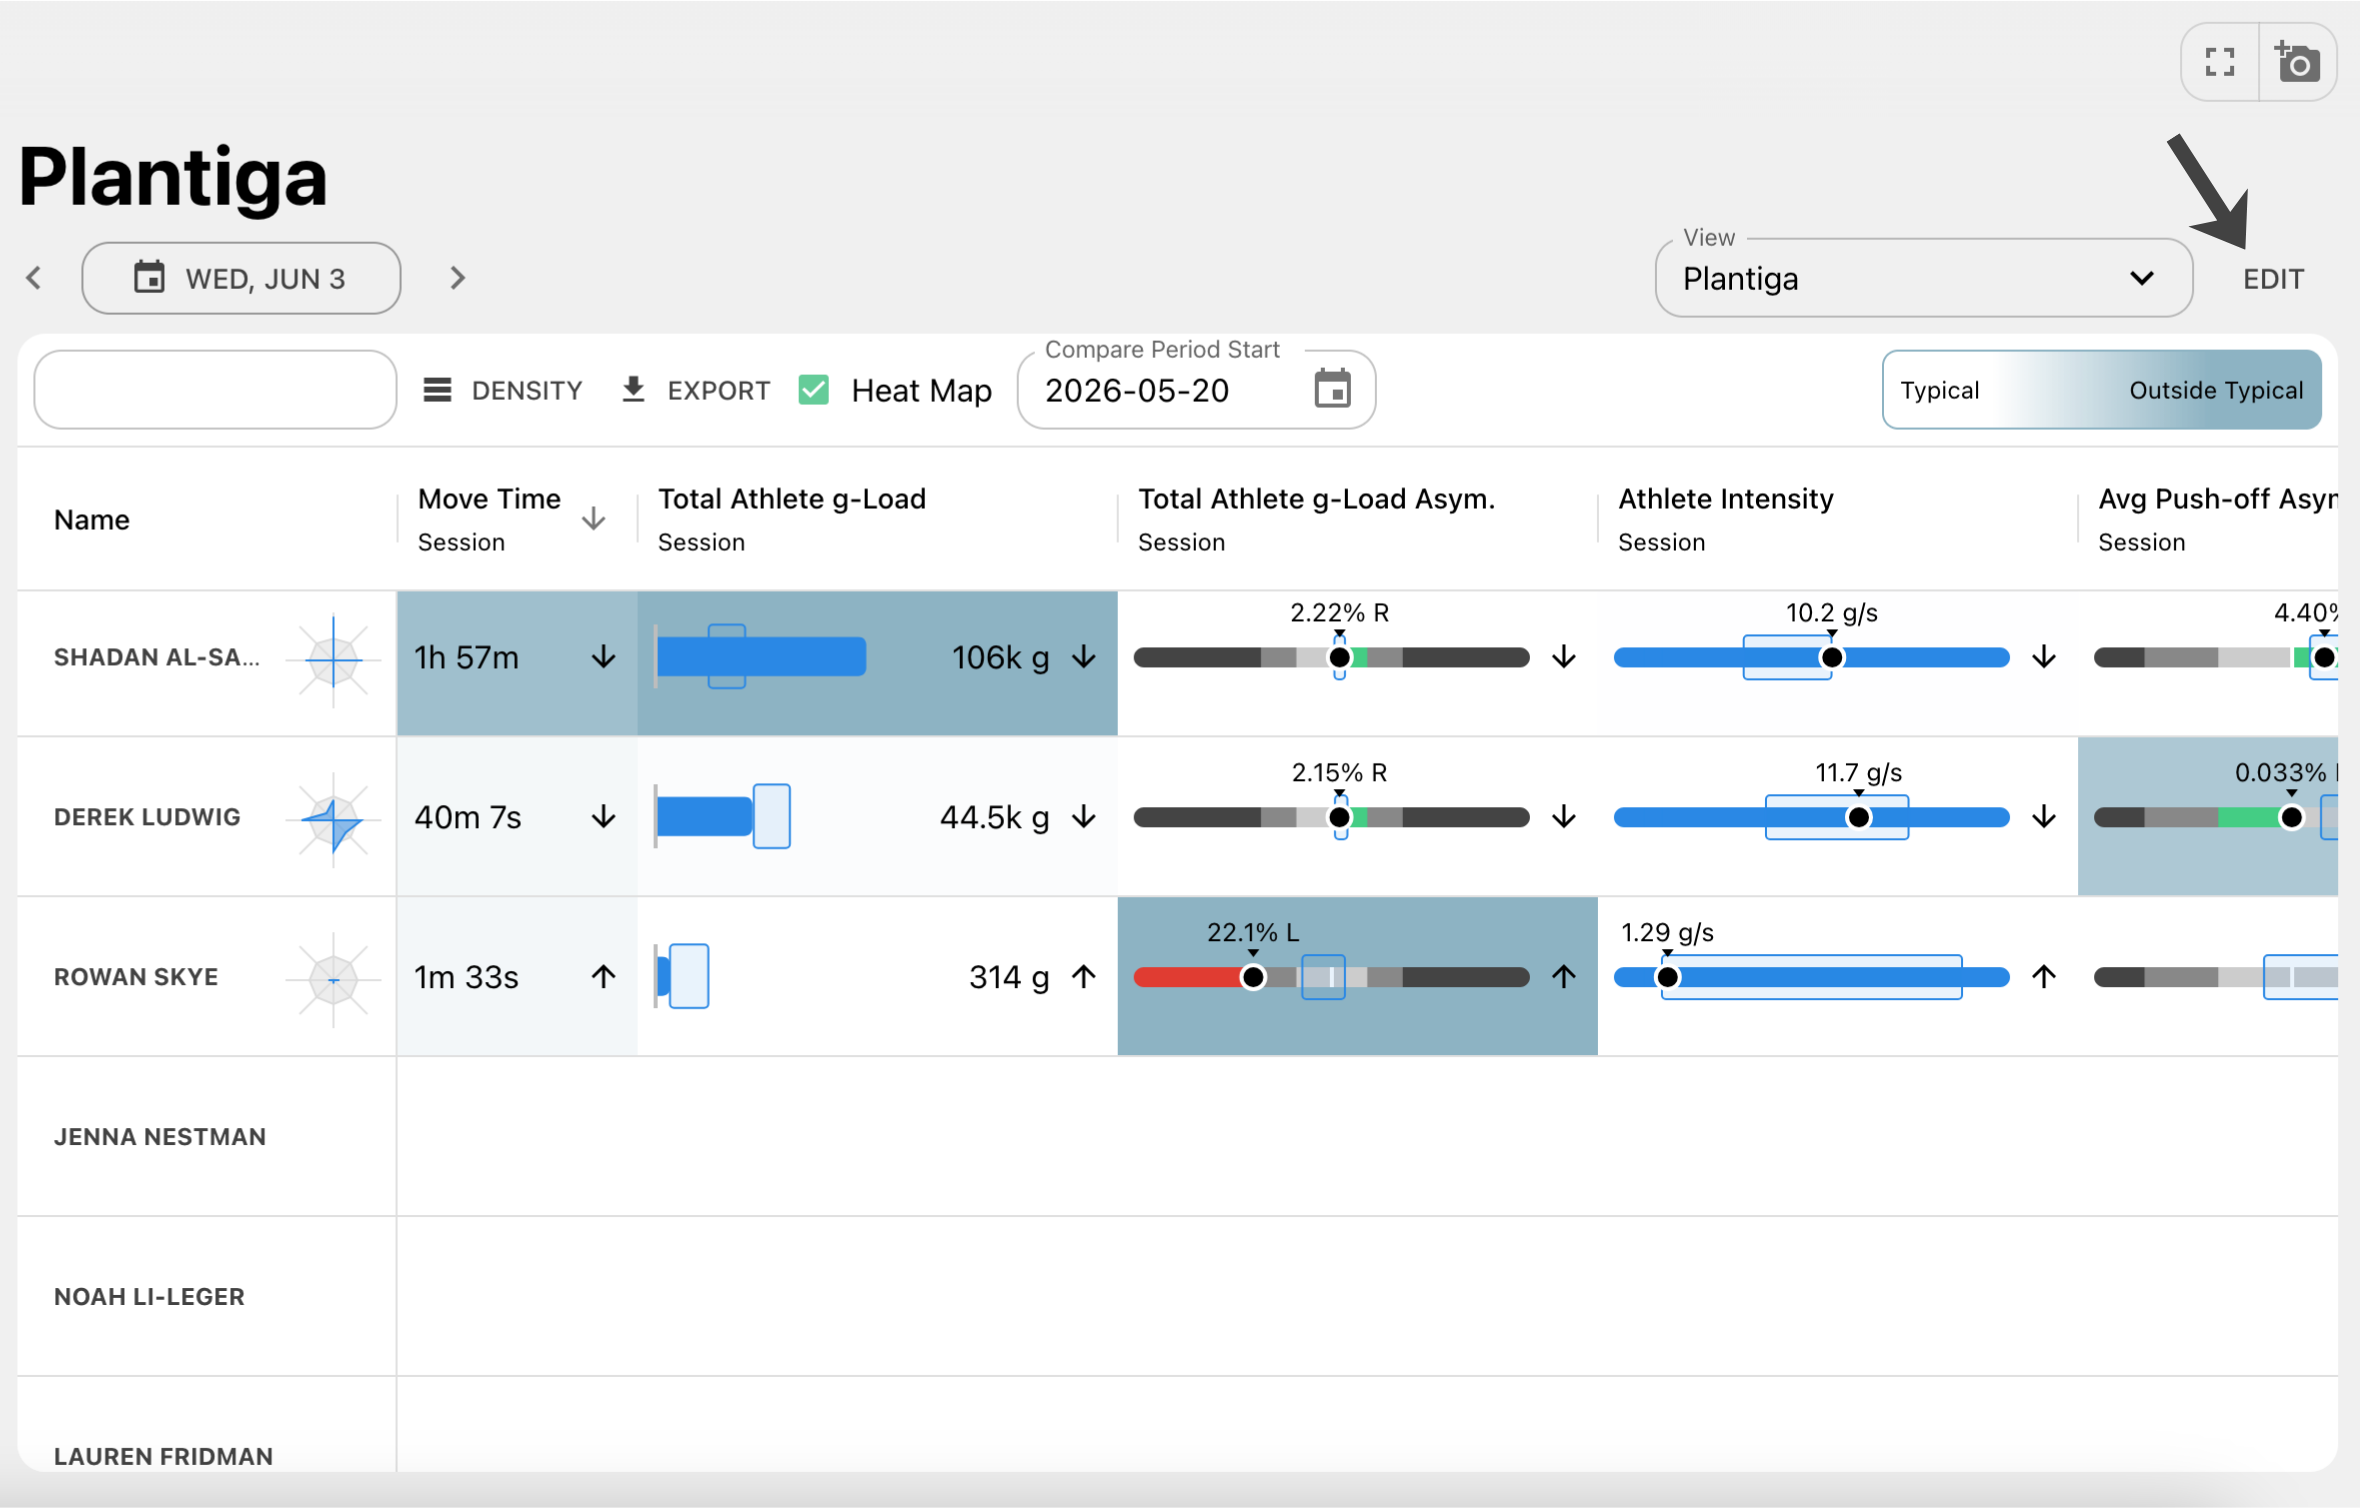
Drag and drop metric names to re-arrange your overview. Click the minus sign in the top right corner of a metric to remove it.
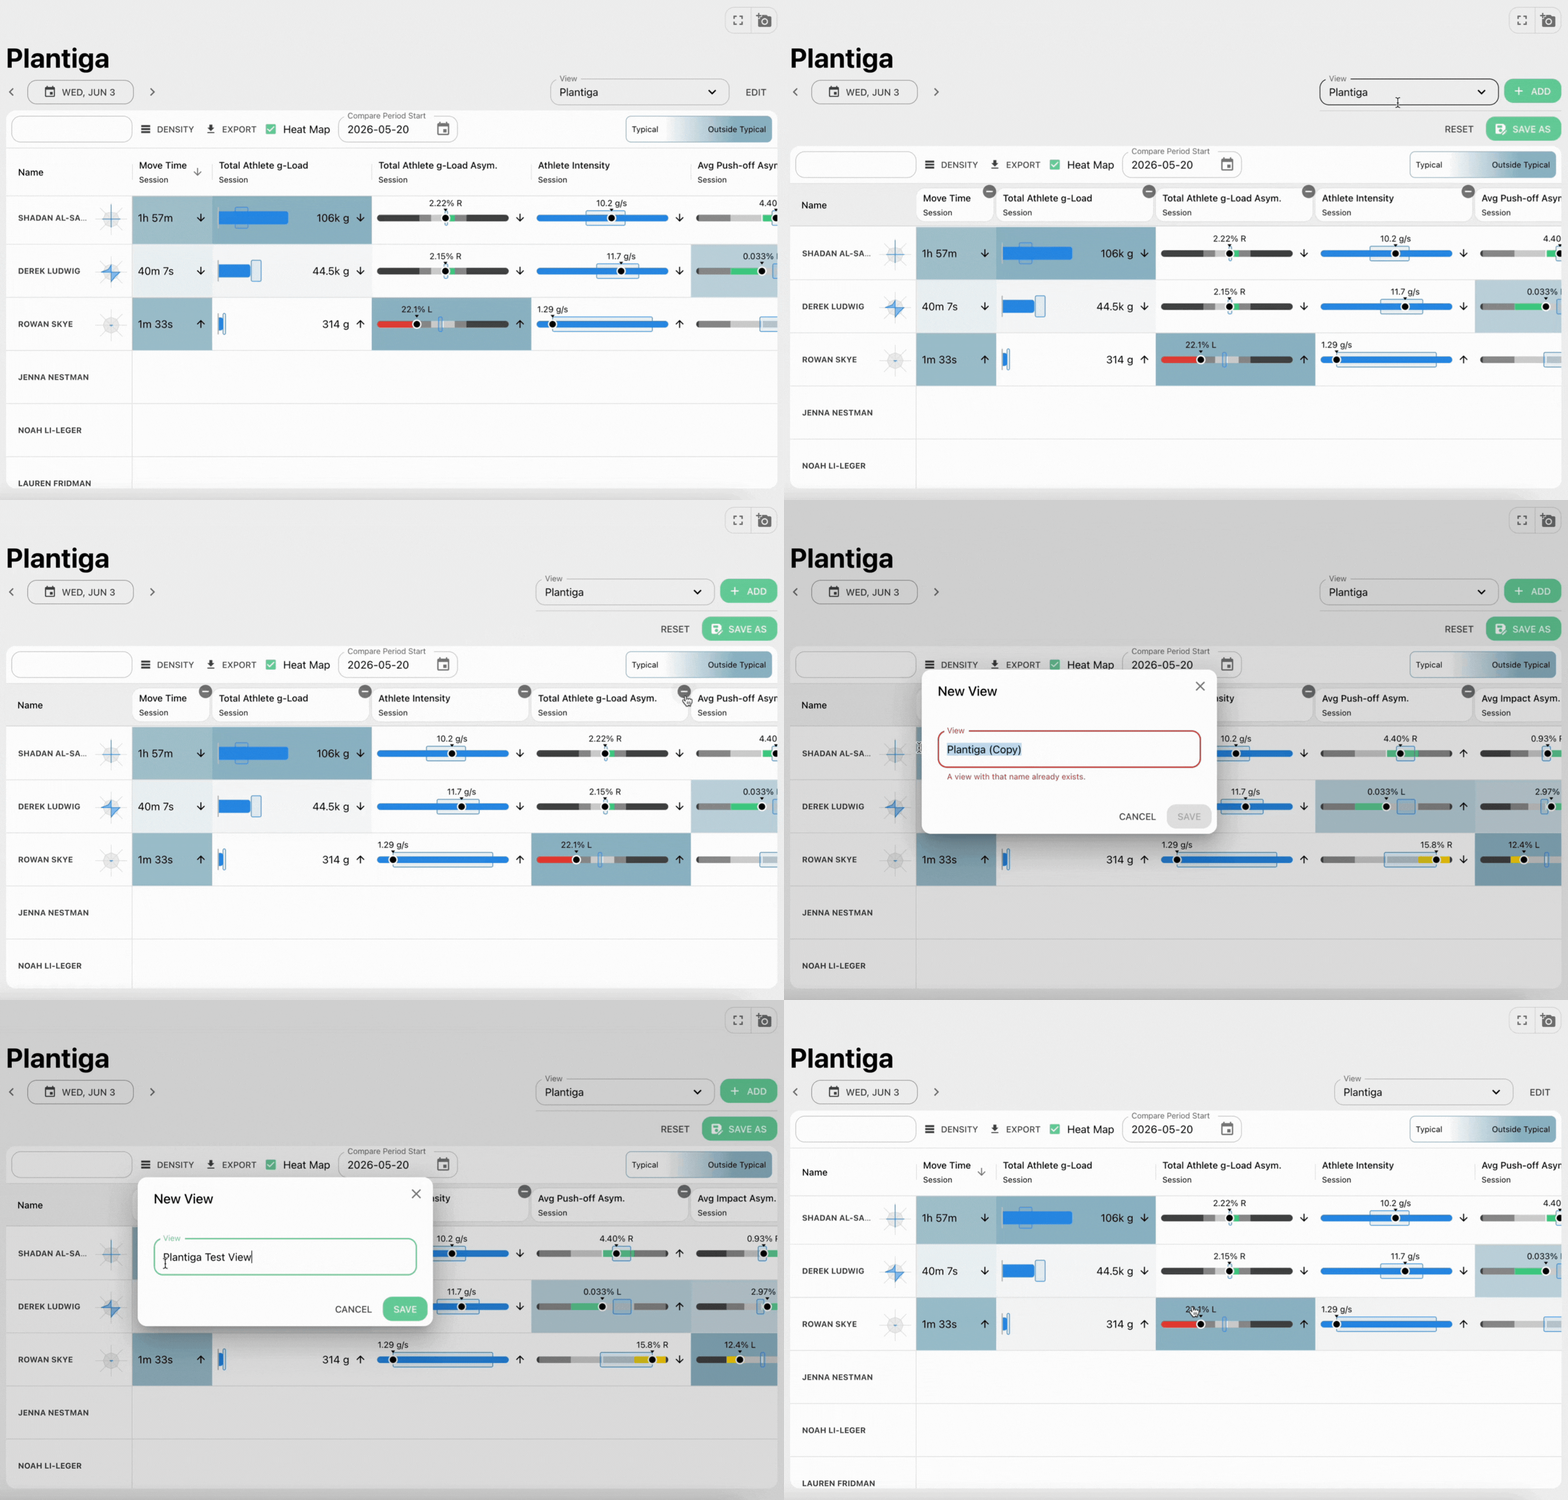
Click ADD to choose metrics specific to what you care about. Metrics can be specific to an Activity Type or Movement Type (e.g. add max speed for Games and ground contact time for walking).