.png?height=120&name=Plantiga%20lockup%20black%20(1).png)
Measure your walking and running speed over the entirety of an activity.
The speed algorithm captures maximum and average speed for running and walking activities and also shows the speed profile over the entirety of the activity. Average and max speed are shown for each activity, as are the continuous speeds for each foot. Acceleration and deceleration profiles are represented by the curves at the beginning and end of each sustained speed.
How we calculate Speed
Speed is measured at the centre of body mass by calculating the average speed for each footstrike. The calculation is recalibrated each time each foot hits the ground, or experiences zero velocity, providing an accurate measure of continuous walking and running speed.
How to interpret the Speed plot on Plantiga.io
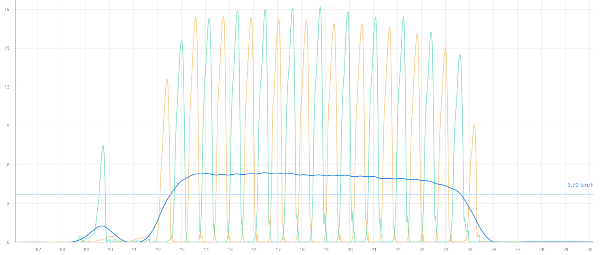
Speed is generated for walking and running activities. In the graph, the dark blue line represents the centre of mass speed profile over the entire activity. When the “Show foot speeds” box is checked, the green and orange lines represent the individual speed profiles of the right and left foot respectively. When the “Show average speed for region” box is checked, the light blue line represents the average speed for the portion of the activity currently in view. Zooming in on the graph by clicking and dragging will bring a smaller portion of the activity into view, and the average speed will be recalculated for this region.
Summary bar:
- Duration: how long the activity lasted (HH:MM:SS)
- Maximum: the absolute fastest speed reached during the activity
- Average: the average speed over the entire activity
Graph:
- X-axis: time of day
- Y-axis: speed (mph or kph)
- Dark blue line: speed profile
- Light blue line: average speed for region
- Green line: right foot speed
- Orange line: left foot speed
What to look for:
- Changes in max and average speeds for running and walking activities of the same length over time - key measures of performance and recovery
- Acceleration and deceleration curves - how quickly people are able to get up to speed and then come to a stop can provide insight into explosive power and musculoskeletal stability
- Pacing consistency over the course of longer running or walking activities
- Absolute maximum speed vs. maximum sustainable speed using regional averages